

OpenTelemetry can separate application instrumentation from the monitoring backend. That reduces one kind of lock-in—but it also gives your team a pipeline to operate.
The expensive part of changing monitoring tools is often inside the applications
An organization wants to change its observability platform. The new backend can store traces, metrics and logs, but dozens of services use the old vendor’s agents, libraries, field names and exporters.
The difficult work is not creating a new account. It is changing application code, deployment configuration and operational conventions across every service.
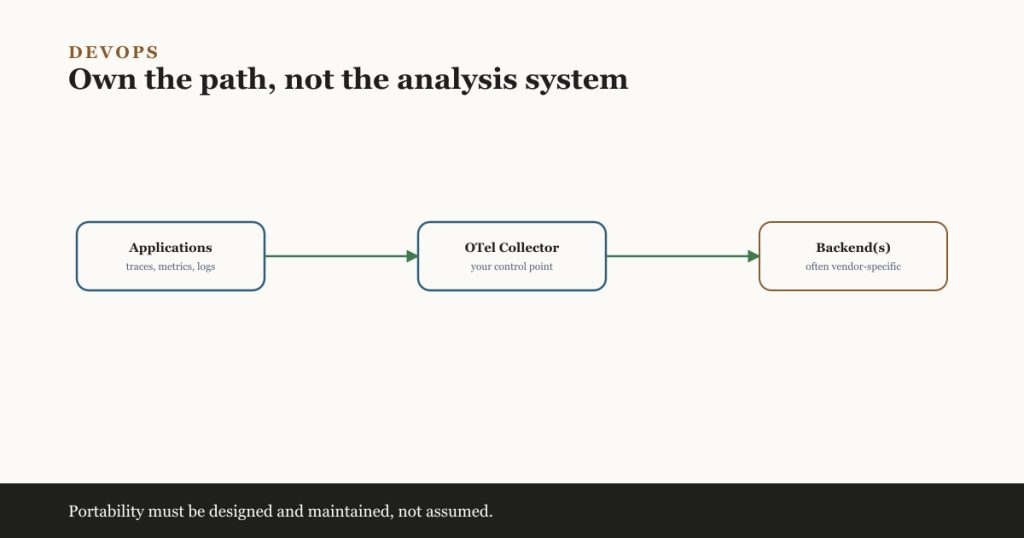
OpenTelemetry addresses that boundary. It gives applications a vendor-neutral way to generate, describe, collect and export telemetry. Applications can emit standard signals to an OpenTelemetry Collector, and the Collector can process and route those signals to one or more backends.
This is why owning the telemetry pipeline matters: the decision about where data goes can move out of every application and into a controlled platform layer.
But OpenTelemetry does not provide a complete observability platform. It does not store the data, run your queries, build dashboards or manage alerts. Those responsibilities remain with other systems.
What OpenTelemetry actually standardizes
Telemetry is evidence produced by a running system:
- traces follow a request across services;
- metrics measure values over time;
- logs record events and details;
- profiles, still less mature in OpenTelemetry, describe where programs spend resources.
OpenTelemetry provides APIs and SDKs for creating this data, semantic conventions for naming common information, the OpenTelemetry Protocol (OTLP) for transporting it, and a Collector for receiving, processing and exporting it.
The Collector acts as a programmable pipeline. It can batch data, add resource information, remove sensitive fields, sample traces, translate formats and send different signals to different destinations.
What “owning the pipeline” means
Ownership does not necessarily mean running every component yourself. It means retaining control over the contract between applications and observability vendors.
| Layer | With an OpenTelemetry-first design | Portability level |
|---|---|---|
| Application instrumentation | OpenTelemetry APIs, SDKs and automatic instrumentation | Relatively high |
| Signal naming | Standard semantic conventions plus organizational rules | High when conventions are followed |
| Transport | OTLP or supported open formats | Relatively high |
| Processing and routing | Collector configuration and processors | Portable until vendor-specific components are introduced |
| Storage | Selected open-source or commercial backend | Backend-specific |
| Query language | Defined by the backend | Usually low |
| Dashboards and alerts | Built in the backend or another visualization layer | Often low |
| Retention and cost controls | Backend and architecture choices | Backend-specific |
OpenTelemetry therefore reduces instrumentation lock-in. It does not guarantee that dashboards, queries, alerts or historical data can move without work.
That is still valuable. Replacing dashboards is inconvenient; reinstrumenting hundreds of services while keeping production stable is usually much harder.
The Collector creates a useful control point
Without a Collector, each application may send telemetry directly to a backend. That can be acceptable for a small experiment. At scale, it spreads endpoint configuration, credentials, sampling rules and vendor exporters across the estate.
A Collector provides one place to:
- change destinations without rebuilding every application;
- batch and compress data before export;
- remove secrets or personal information;
- enrich signals with environment and ownership metadata;
- sample high-volume traces;
- send security or reliability data to separate systems;
- maintain a temporary dual-export path during migration.
It also becomes production infrastructure. If the Collector is overloaded, misconfigured or unavailable, telemetry can be delayed or dropped precisely when an incident makes it most valuable.
Open standards do not remove operational work
The strongest OpenTelemetry marketing claim is freedom from vendor lock-in. The uncomfortable truth is that portability must be designed and maintained.
Teams can recreate lock-in by:
- using a vendor-specific Collector distribution without understanding its additions;
- depending heavily on proprietary processors or exporters;
- naming attributes inconsistently across teams;
- building all operational knowledge into one backend’s query language;
- retaining no tested route to a second destination;
- assuming every language SDK and signal has identical maturity.
The Collector itself needs capacity planning, upgrades, secure configuration and monitoring. Larger environments commonly use collectors close to workloads and a gateway tier for centralized processing and export. A single global Collector can become a bottleneck and a failure domain.
OpenTelemetry and Prometheus are not competitors
Prometheus is widely used for collecting, storing and querying time-series metrics and powering alerts. OpenTelemetry covers a broader instrumentation and transport layer across traces, metrics and logs.
An organization may continue using Prometheus while adopting OpenTelemetry libraries, semantic conventions and Collectors. The technologies can complement each other. Replacing a working Prometheus deployment is not a prerequisite for becoming OpenTelemetry-oriented.
The better question is where standardization removes duplicated work. For one team, that may be distributed tracing. For another, it may be consistent service metadata across several clouds.
When OpenTelemetry is worth the additional layer
It becomes more valuable when:
- many services use different languages or frameworks;
- several teams need consistent telemetry conventions;
- workloads span clouds, clusters or on-premises systems;
- the organization wants the option to route to more than one backend;
- data filtering or redaction must occur before export;
- telemetry cost needs centralized sampling and routing controls;
- changing a backend would otherwise require application changes.
It may be unnecessary at first when one small application uses one backend, the vendor’s native integration is adequate and nobody is prepared to operate another component. Adding a Collector because it is fashionable creates infrastructure without solving a present problem.
A practical adoption sequence
1. Choose one service journey
Start with a request that crosses a few important services. Define what an operator should be able to learn when it is slow or fails.
2. Establish naming and ownership
Use OpenTelemetry semantic conventions where they apply. Add a small, governed set of organizational attributes such as service owner, environment and deployment version. Avoid unbounded or sensitive values.
3. Instrument before centralizing everything
Generate useful traces and metrics in one service group. Confirm context propagation across boundaries. Do not install a large Collector fleet before proving that the emitted data answers operational questions.
4. Introduce the Collector deliberately
Use it to solve a real requirement: redaction, batching, routing, enrichment or backend independence. Monitor its queue, refused data, export failures, memory and dropped spans.
5. Test portability
Temporarily export a controlled signal set to a second compatible destination. Record which attributes, queries, dashboards and alerts do not translate. Portability that has never been tested is only an assumption.
Know, use or master?
Know: Developers should understand traces, metrics and logs, and know that OpenTelemetry is an instrumentation and transport framework—not a monitoring backend.
Use: Developers, SREs and platform engineers should instrument services, propagate context, configure collectors and investigate missing or excessive telemetry.
Master: Observability platform owners should design collector topology, semantic governance, sampling, redaction, multi-backend routing, capacity and failure handling.
What should you do next?
Pick one important service and answer three questions:
- Is its instrumentation tied directly to one vendor?
- Could the destination change without redeploying the application?
- If the telemetry pipeline failed, would anyone know before an incident?
If the first answer is yes and the next two are no, OpenTelemetry may solve a real architectural problem. If you cannot identify that problem, do not deploy another platform layer yet.
Owning the telemetry pipeline is not about avoiding every vendor. It is about deciding where vendor dependence is acceptable—and preventing it from spreading invisibly into every application.
References and further reading
- What is OpenTelemetry? — OpenTelemetry project. Defines its role in generating, collecting and exporting telemetry and clarifies that it is not a backend. Reviewed September 2026.
- OpenTelemetry documentation — OpenTelemetry project. Current documentation for concepts, language SDKs, the Collector and deployment guidance. Reviewed September 2026.
- OpenTelemetry Collector deployment — OpenTelemetry project. Guidance on deploying collectors alongside workloads and as gateways. Reviewed September 2026.
- OpenTelemetry Collector anti-patterns — OpenTelemetry project, 1 March 2024. Practical cautions about topology, monitoring, distributions and upgrades; the post itself warns readers to recheck older details. Reviewed September 2026.
- CNCF announces OpenTelemetry graduation — CNCF, 21 May 2026. Records the project’s graduation and production-readiness assessment. Reviewed September 2026.